Outlook Report
Executive Summary
The 2018 July Sea Ice Outlook (SIO) for September ice conditions received a total of 39 contributions, variously based on dynamical (physics-based) models, statistical approaches, heuristic (qualitative), and mixed methods. Along with projections of total Arctic sea ice extent for September, the SIO received 9 projections of Antarctic total ice extent and 11 projections of ice extent in the Alaskan sector (combining the Bering, Chukchi, and Beaufort Seas). Thank you to all the contributors!
The SIO, a product of the Sea Ice Prediction Network–Phase 2 (SIPN2) project, is a platform for the research community to compare seasonal predictions of sea ice conditions based on different techniques. It does not provide operational forecasts. The SIO emphasizes, but is not limited to, predictability of Arctic sea ice extent for September, which represents the end of the summer retreat season. The SIO is open to anyone interested in sea ice and its predictability. Participants whose methods provide spatial information on sea ice conditions are encouraged to provide full spatial fields via the SIPN Data Portal, which enables computation of sea ice probability (SIP) and the first ice-free day (IFD) along with other regional metrics.
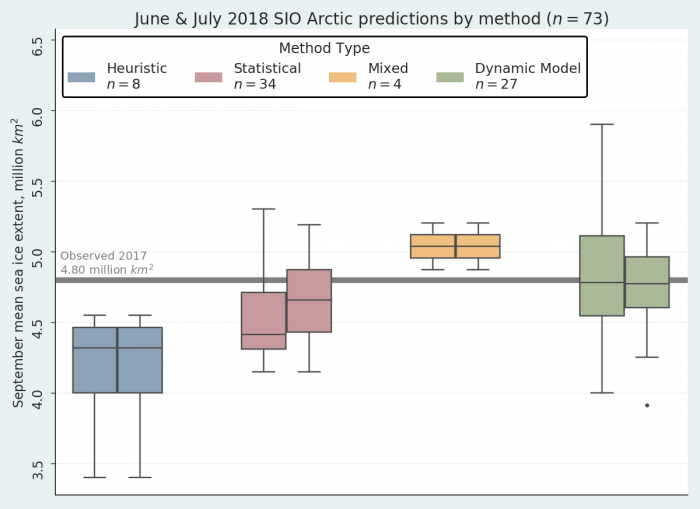
The median of the 39 projections for total September 2018 Arctic extent is 4.7 million square kilometers with lower and upper quartiles values of 4.4 and 4.9 million square kilometers. These projections are slightly higher and show less spread compared with last year's (2017) July projections that had median, lower, and upper quartile values of 4.5, 4.2, and 4.8 million square kilometers, respectively. In contrast to last month's (June 2018) report, the spread in the dynamical models is much reduced. Predictions of September extent from statistical and heuristic approaches are generally below the median value observed in 2017, whereas the modeling contributions predict a September extent similar to that from last year.
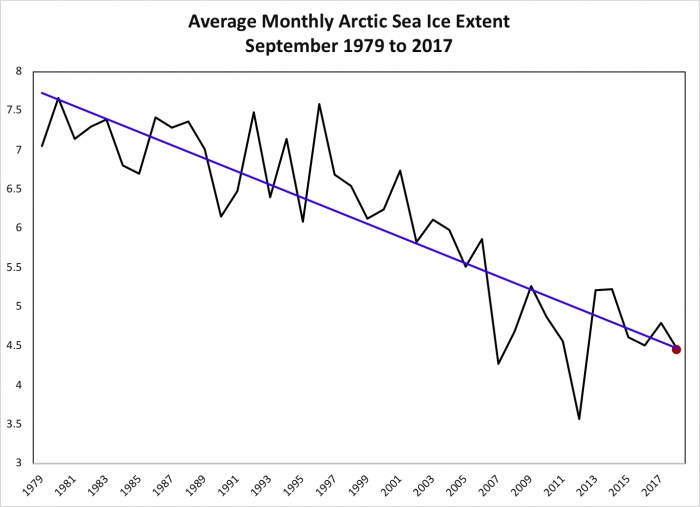
The two lowest September monthly average extents observed in the satellite record are 3.6 million square kilometers in 2012 and 4.3 million square kilometers in 2007. A conclusion drawn from last month's (June 2018) report is that it is highly unlikely that there will be a new record low September extent this year. Results from the July 2018 report reinforce this conclusion—only two of the July projections of total September extent are below 4.0 million square kilometers. While the observed May sea ice extent was well below the long-term average, atmospheric conditions during June and through the first half of July have favored a fairly slow rate of summer ice retreat.
The median prediction of September extent in the Alaska sector is 0.49 million square kilometers; this compares to 0.47 from the June predictions. Observed summer ice loss has so far been slow in this sector of the Arctic, and there was a slight increase in sea ice within the Beaufort Sea during the first half of July. The July prediction for total Antarctic extent in September is 18.9 million square kilometers, compared to 18.3 million square kilometers from the June prediction.
This report is organized as follows: (1) an overview of projections of total September Arctic ice extent, (2) predicted spatial fields, SIP, and IFD from dynamical models; (3) current Arctic ice conditions and relationships with atmospheric conditions; (4) regional ice conditions; (5) projections of Antarctic ice extent. Contributions to the 2018 SIPN/Year of Polar Prediction community forecast experiment, the Sea Ice Drift Forecast Experiment (SIDFEx), are still coming in, and will be discussed when available.
This July Outlook was developed by lead authors Mark Serreze, National Snow and Ice Data Center (NSIDC) and Julienne Stroeve, University College London, NSIDC (Overview, discussion of current conditions, discussion of modelling contributions, and discussion of regional conditions); Edward Blanchard-Wrigglesworth, U. Washington and Nic Wayland, U. Washington (Discussion on predicted spatial fields and Antarctic contributions); Hajo Eicken, International Arctic Research Center (Discussion of ice conditions in the Bering and Chukchi Seas); Bruce Wallin, NSIDC (statistics and graphs); Betsy Turner-Bogren, Helen Wiggins, and Stacey Stoudt, ARCUS (report coordination and editing); and the rest of the SIPN2 Leadership Team.
Please note: The Sea Ice Outlook provides an open process for those interested in Arctic sea ice to share predictions and ideas; the Outlook is not an operational forecast.
See July call for contributions
Overview
Of the 39 July 2018 SIO contributions providing projections of September 2018 Arctic sea ice extent, 15 are based on dynamical models, 18 are based on statistical methods, 4 are based on heuristic approaches (qualitative analyses), and 2 are based on mixed methods (a combination of statistical and heuristic approaches) (Figure 1).
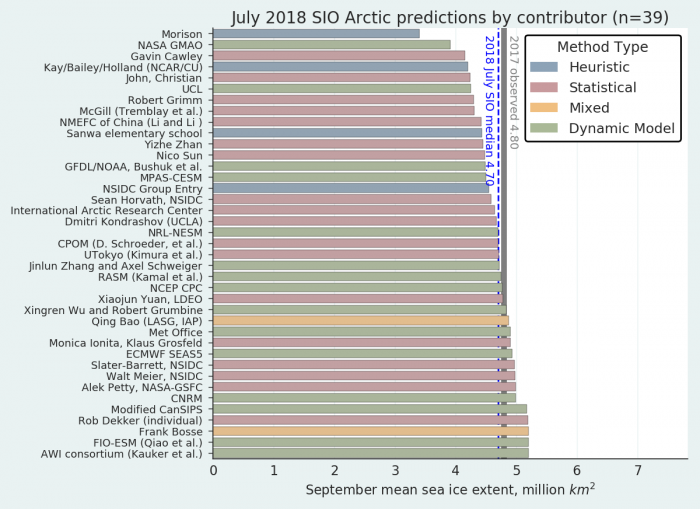
The median projection of total September 2018 sea ice extent based on all methods is 4.7 million square kilometers, with lower and upper quartiles in the distribution of 4.4 and 4.9 million square kilometers, respectively. While the June 2018 projections of September ice extent (see last month's report) based on dynamical models had the largest spread compared to other methods, this spread was significantly reduced in the July SIO, with an interquartile range of 4.6 to 5.0 million square kilometers —a slightly smaller spread than seen in the heuristic (interquartile range of 4.0 to 4.5 million square kilometers) and statistical forecasts (interquartile range of 4.4 to 4.9 million square kilometers) (Figure 2). The mixed method forecasts were both similar to each other, 5.0 and 5.1 million square kilometers, respectively.
The two lowest September monthly average extents observed in the satellite record are 3.6 million square kilometers in 2012 and 4.3 million square kilometers in 2007. Only two of the projections are for a September extent below 4.0 million square kilometers. Reinforcing conclusions from last month's report (June), based on the projections it is highly unlikely that a new record low September extent will be reached this year. As was also the case for the June projections, except for the highest (5.2 million square kilometers) and the two lowest contributions (3.4 and 3.91 million square kilometers), all of the projections fall within a fairly narrow range of approximately 1.0 million square kilometers. Extrapolation of the linear trend line of September extent as assessed from the satellite passive microwave record (Figure 3) would yield a September average extent of 4.45 million square kilometers, falling within the upper and lower quartile range of the SIO projections.
The median prediction of September extent in the Alaska sector is 0.49 million square kilometers; this compares to 0.47 million square kilometers from the June predictions. Observed summer ice loss has so far been slow in this sector of the Arctic. The July prediction for total Antarctic extent in September is 18.23 million square kilometers, compared to 18.26 million square kilometers from the June predictions.
Comment on 2018 Modeling Contributions
Out of the 15 modeling contributions received for the July SIO, 3 were coupled ice-ocean models forced by atmospheric reanalysis and 12 were fully coupled ice-ocean-atmosphere models. The fully coupled dynamical models have a slightly higher overall median extent of 4.81 million square kilometers compared to 4.72 million square kilometers for the ice-ocean coupled models.
Comment on Sea Ice Probability (SIP) and First Ice-Free Date (IFD) Predictions from Spatial Fields
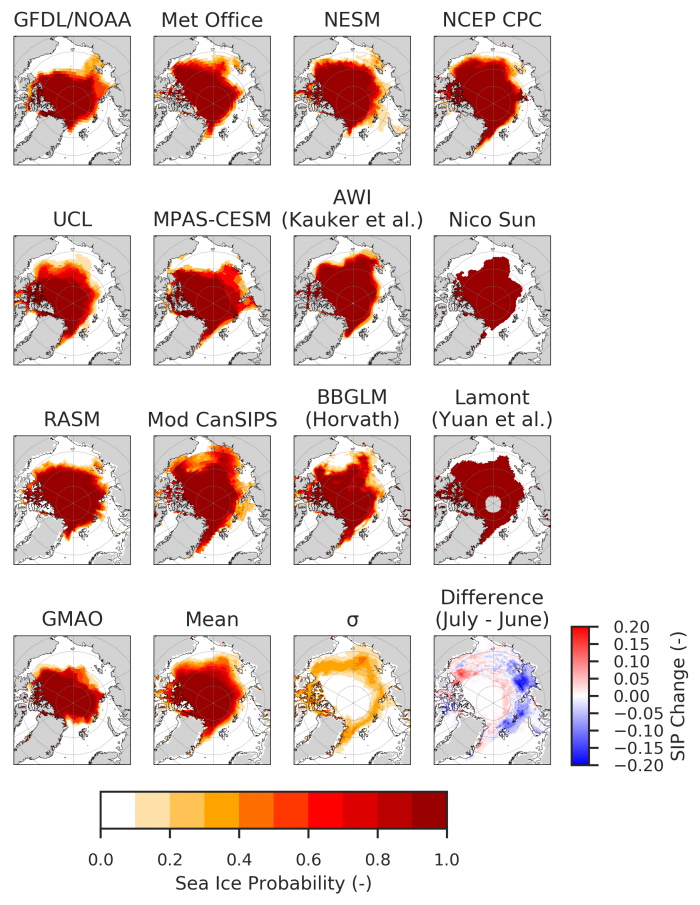
As in recent years, we have invited forecasts of sea ice probability (SIP) and the first ice-free date (IFD). Additionally, SIPN is now producing SIP and IFD forecasts directly from contributors' sea ice concentration (SIC) forecasts, and we encourage contributors to submit full field SIC forecasts whenever possible. SIP is defined on grid cell by grid cell basis as the fraction of ensemble members in an ensemble forecast with September ice concentration exceeding 15%. IFD is the first date in the retreat season at which the ice concentration at a given grid cell first drops below 50% and stays below 50% for the following 10 days. For this July 2018 SIO, we received 14 submissions of SIP (11 dynamical, 3 statistical) and 10 of IFD, both record high numbers.
Sea Ice Probability (SIP)
Most forecasts are similar to those provided for last month's (June 2018) SIO report. Forecast uncertainty (the spread) across models is highest in the East Siberian sea, a feature also seen in past years as some models forecast a tongue of sea ice extending south toward the coastline while others forecast open conditions. There is a slightly lower forecast probability for the Northeast Passage (Northern Sea Route) to be ice-covered this September (mean model forecast SIP of ~10-20%) compared to June SIO (mean model forecast SIP ~30%). Compared to the June multi-model mean, the July multi-model mean forecast shows an interesting pan-Arctic dipole (considering only models that submitted SIP forecasts to both June and July SIOs): increased SIP (~10% relative to the June model-mean forecast) in the Beaufort, Chukchi, and East Siberian seas, and decreased SIP (~10-15%) in the Laptev, Kara, and Barents seas (see lower right panel of Figure 4).
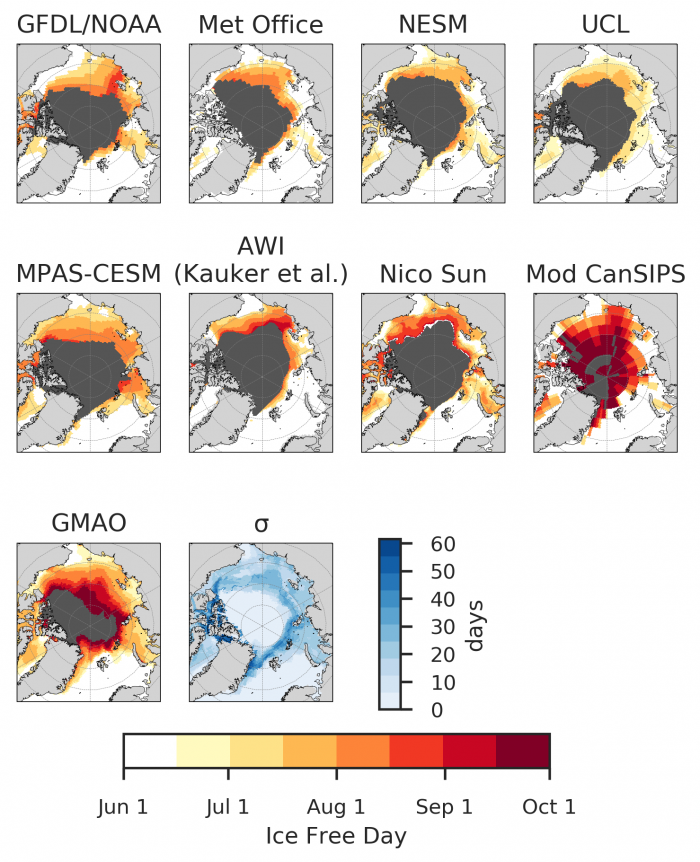
Ice-Free Date (IFD)
As was the case in the June 2018 SIO, we see significant spread in IFDs across models, the inter-model spread being over a month along the marginal sea ice zone. (Figure 5)
Recent Conditions
This analysis of observed Arctic and Antarctic sea ice and associated atmospheric conditions draw strongly from the National Snow and Ice Data Center's (NSIDC) Arctic Sea Ice News and Analysis.
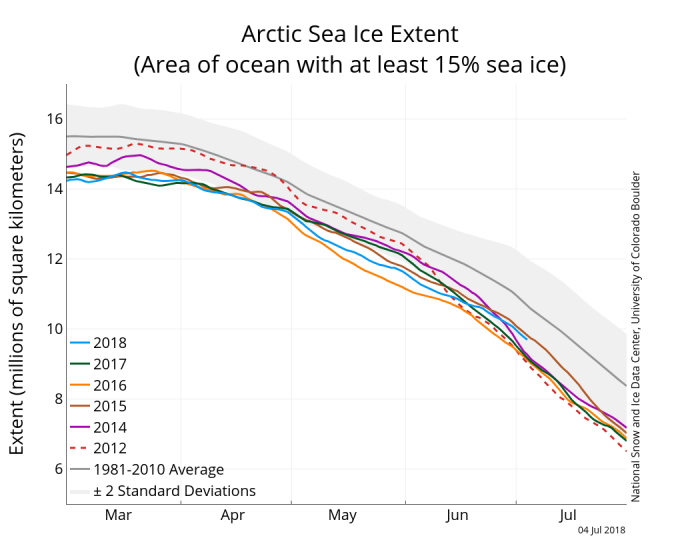
While Arctic sea ice extent through the month of May remained far below average, the average daily rate of ice loss slowed in June relative to climatology (Figure 6). Arctic sea ice extent averaged for the month of June 2018 was 10.7 million square kilometers, slightly more than one million square kilometers below the 1981 to 2010 satellite average and 0.36 million square kilometers above the record low June extent set in 2016. Extent for June 2018 ended up as the fourth lowest June average extent in the satellite record. Starting the third week of July, the pace of ice loss began to increase relative to climatology; this appears to reflect rapid ice loss in Hudson Bay.
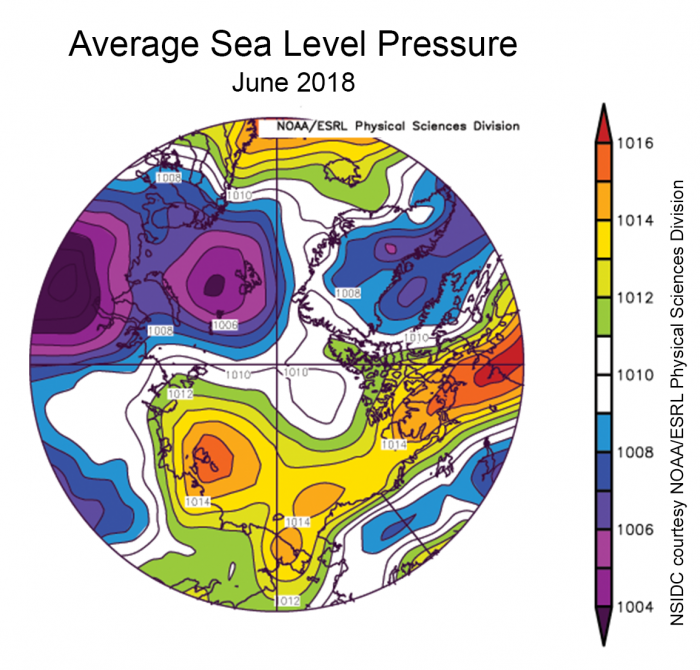
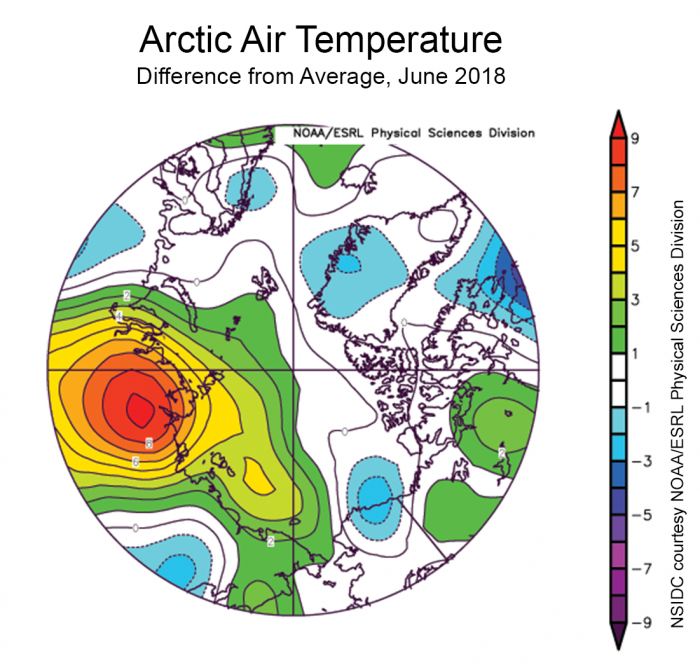
The relatively slow rate of ice loss in June reflects the prevailing pattern of atmospheric circulation and temperature for the month. The monthly sea level pressure pattern (Figure 7) featured low pressure centered over the northern Barents Sea, and a high pressure cell centered over the Laptev Sea. A ridge of high pressure also extended eastward into northern Canada. Winds from the south between the low pressure area in the Barents Sea and the high pressure area in the Laptev Sea gave rise to a pronounced region of above-average temperatures (at the 925 hPa level) centered over Central Siberia and extending over the Laptev and East Siberian Seas (Figure 8). This helps to explain low sea ice extent for June in the Laptev Sea sector. According to Rick Thoman of the National Weather Service, slow ice loss in the Beaufort Sea was related to persistent winds from the east and northeast.
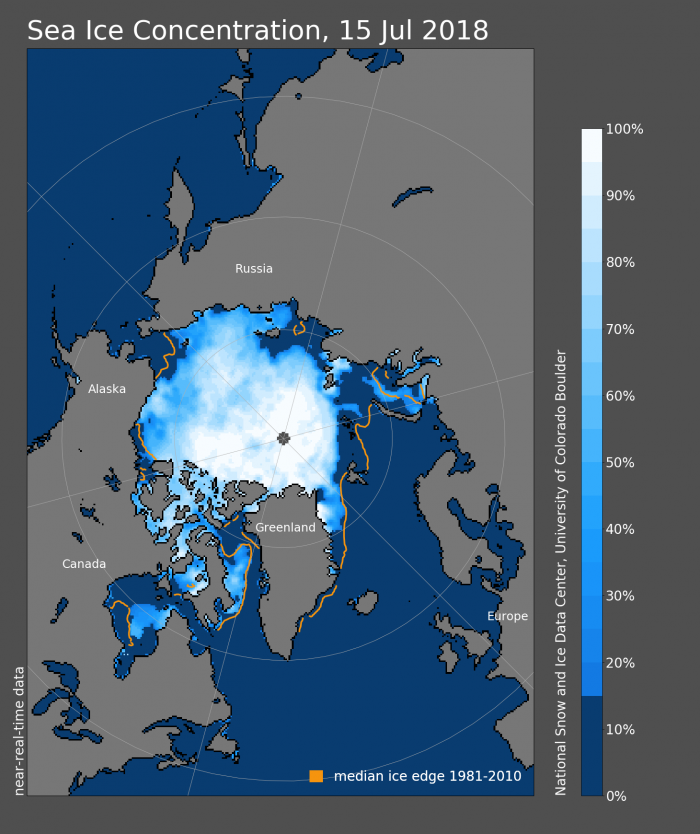
As of 15 July 2018, ice extent was well below average in the Barents Sea and the East Greenland Sea. Because of the slow retreat through June, extent in the Chukchi Sea, while below average, is now closer to average than was the case at May's end (Figure 9).
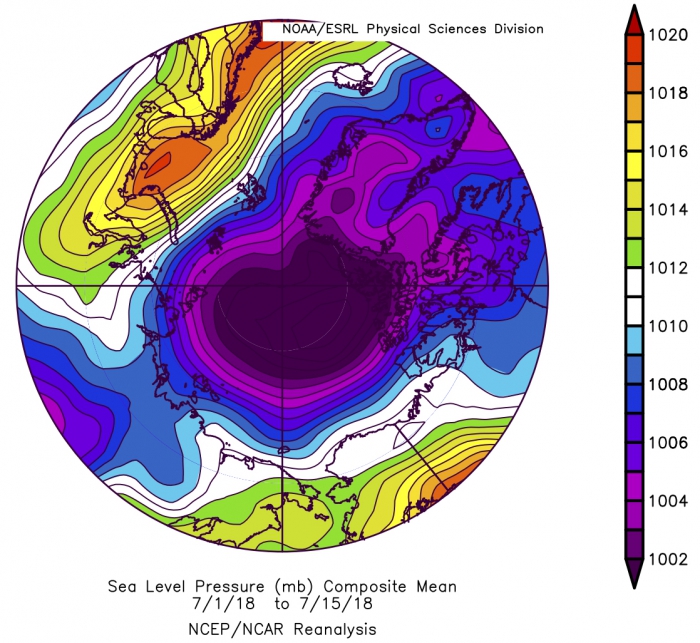
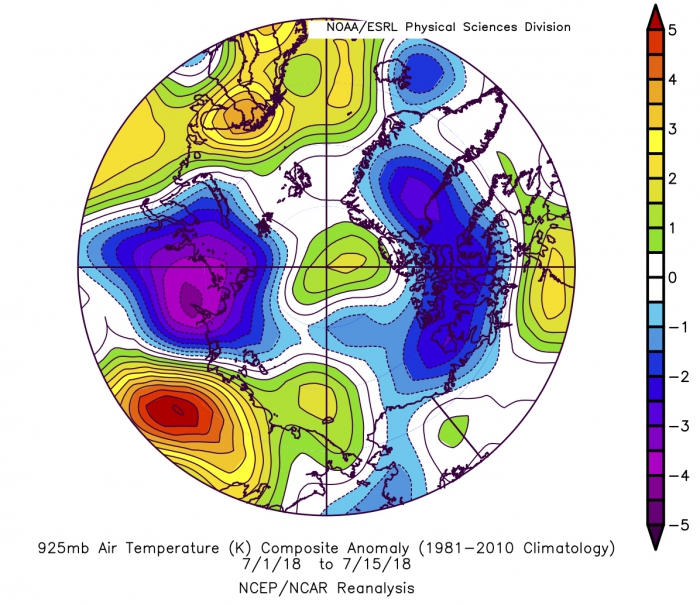
As averaged for the first 15 days of July 2018, low sea level pressure has dominated almost all of the Arctic Ocean (Figure 10). Historically, such a pattern has tended to slow summer ice loss rates; air temperatures tend to be fairly low, precipitation will often be in the form of snow (keeping the surface albedo high), and the wind-driven cyclonic pattern of ice motion will tend to be slightly divergent, spreading out the ice to cover a larger area. While this type of circulation pattern tends to be associated with below average air temperatures, the anomaly pattern at the 925 hPa level for the first 15 days of July 2018 features a mix of above and below average temperatures (Figure 11). Regardless, the pattern so far this summer is consistent with fairly low rate of ice loss. A cyclonic circulation pattern at the surface over the Arctic Ocean is associated with a deep, well-pronounced circumpolar vortex at the 500 hPa level.
The two-week forecast of 500 hPa heights from NOAA (Figure 12) points to a well-developed polar vortex centered just off the North Pole, arguing for continuation of the pattern on low pressure at the surface.
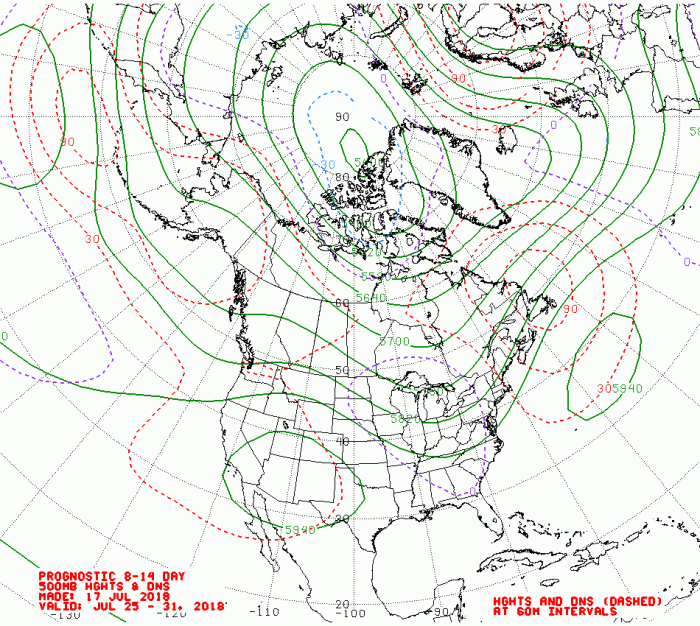
Note that the past two summers (2016 and 2017) were dominated by low pressure over the central Arctic Ocean. This has broken the pattern, observed over the last two decades, of generally anticyclonic conditions over the Arctic Ocean that tends to favor large summer ice loss rates.
Over several days at the beginning of July, smoke from forest fires in Siberia drifted over the Arctic Ocean. The smoke streamed over the East Siberian, Chukchi, and Beaufort Seas and eventually across Alaska into northern Canada. Its effects on the melt season remain to be seen; there are competing effects of scattering of solar radiation and deposition of smoke particles on the surface that will lower the albedo.
Turning briefly to the South, the Antarctic sea ice cover expanded at a faster-than-average pace in June, bringing ice extent closer to typical values for this time of year. This follows a period of below-average ice extent that has persisted since austral winter in 2016. Sea ice extent is presently near average in all sectors except the northeastern Weddell Sea, and a small area in the northern Davis Sea. Higher-than-average air temperatures at the 925 hPa level prevailed in these regions, and cool conditions prevailed over the northern Ross Sea.
Regional Sea Ice Extent Discussions
Alaska Regional Extent Outlooks
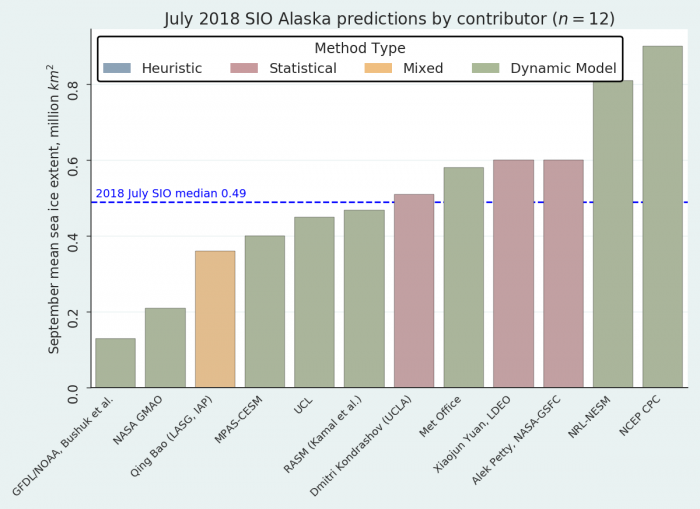
The July 2018 SIO report received 12 September outlooks for the Alaska region, which combines the Bering, Chukchi, and Beaufort Seas (Figure 13). The median of the 12 predictions for September is 0.49 million square kilometers, essentially the same as the June forecast of 0.50 million square kilometers. Eight of the forecasts were based on dynamical models, with a median forecast of 0.5 million square kilometers, whereas the three statistical forecasts suggested slightly higher overall extent of 0.6 million square kilometers. This likely reflects the overall slow loss of ice in this region despite record low extents within the Bering Sea this last winter. Interestingly, two dynamical model forecasts predict ice conditions should retreat significantly by September, with a regional extent of 0.2 million square kilometers or less. In 2017, the median July SIO forecast was 0.4 million square kilometers, while the observed value was 0.32 million square kilometers.
Bering and Chukchi Seas
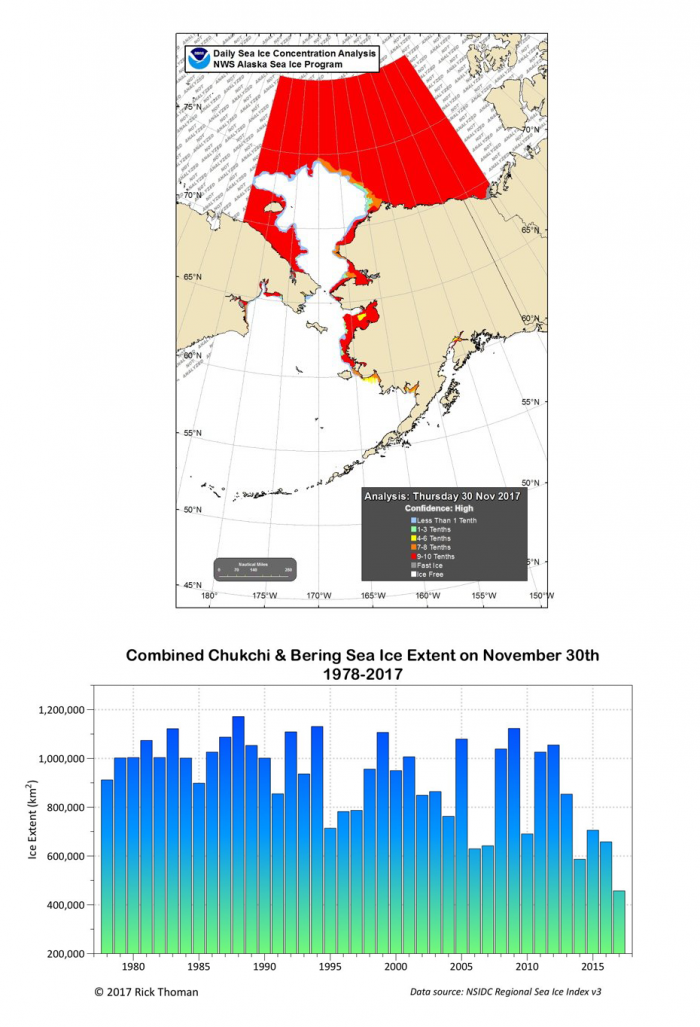
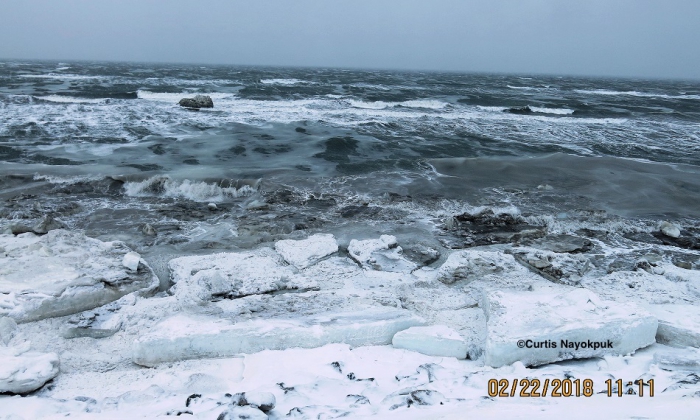
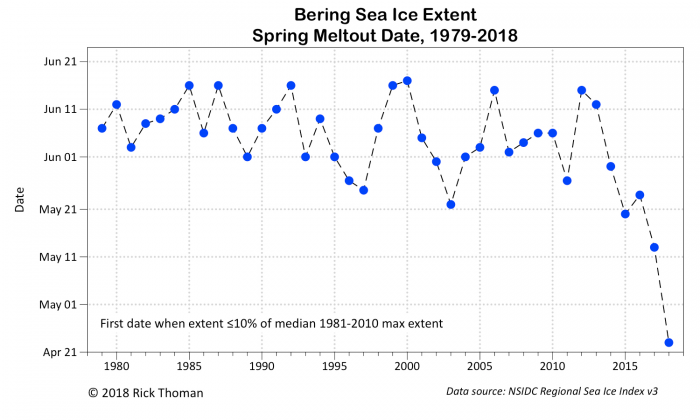
As discussed briefly in the June 2018 SIO report, winter ice extent in the Bering and Chukchi Seas was well below average during the winter of 2017/2018. For the combined Beaufort and Chukchi Sea region, extent at the end of November was the lowest in the satellite record (Figure 14). Chukchi Sea ice-over (taken as the first day with more than 95% ice extent over the entire Chukchi Sea) occurred on 31 December and was the latest observed since the start of the satellite record. Moreover, Bering Sea winter ice extent was the lowest observed in the entire historical record (the past 160 years, see Historical Sea Ice Atlas), with many coastal communities in the Bering Straits reporting a near-complete absence of sea ice into February (Figure 15; see also Sea Ice for Walrus Outlook (SIWO). An in-depth analysis of ice conditions is underway, but a combination of residual ocean heat and positive sea surface temperature anomalies into winter and northward atmospheric flow persisted into early 2018, keeping ice at bay. Moreover, Bering Sea ice melt-out was two weeks earlier than the previous record, falling in late April (Figure 16). However, as noted above, by the middle of July, extent was only slightly below average in the Chukchi Sea. This appears to be, at least in part, due to coastward drift of ice from the north that compensated for the in situ melt within the Chukchi.
More details of the extraordinary low ice winter in the region (with a near complete absence of sea ice west of St. Lawrence Island) in the context of the SIO will be provided in a separate summary being prepared by M. Druckenmiller (available late July. Editor's note: this summary is available at the end of this report, the last file in the "Individual Outlook PDFs" section).
Antarctic Discussion
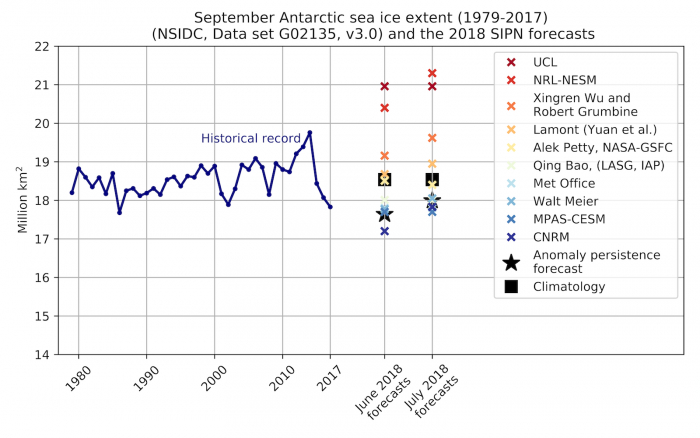
From June to July, models show either an increase or no change in the predicted September Antarctic sea ice extent (Figure 17). The anomaly persistence forecast also points to a slight increase, reflecting the recent faster-than-average expansion of sea ice. Overall, there is still a very large spread in the forecasts, with the spread spanning both record high and low extents. Nevertheless, the spread is skewed, with 7 out of 10 models extent forecasts clustering between 17.7 and 19 million square kilometers.
Summary Table Of Key Statements From Individual Outlooks
![]() Summary Table of Key Statements from Individual Outlooks
Summary Table of Key Statements from Individual Outlooks
Individual Outlook PDFs
This This 2018 Sea Ice Outlook July Report was developed by the SIPN2 Leadership Team
Report Leads
Mark Serreze, National Snow and Ice Data Center (NSIDC)
Julienne Stroeve , University College London and NSIDC
Additional Contributors:
Bruce Wallin, University of Colorado, Boulder, NSIDC
Edward Blanchard-Wrigglesworth, University of Washington, Department of Atmospheric Sciences
Hajo Eicken International Arctic Research Center
Nicholas Wayand, University of Washington, Department of Atmospheric Sciences
Editors:
Betsy Turner-Bogren, ARCUS
Helen Wiggins, ARCUS
Stacey Stoudt, ARCUS
Suggested Citation:
Serreze, M., J. Stroeve, U. S. Bhatt, W. Meier, F. Massonnet, E. Blanchard-Wrigglesworth, L. C. Hamilton, C. M. Bitz, J. E. Overland, H. Eicken, H. V. Wiggins, M. Wang, P. Bieniek, J. Little, J. Walsh, J. Kurths, M. Steele, E. Hunke, N. Wayand, T. Jung, and B. Wallin. Editors: Turner-Bogren, B., H. V. Wiggins and S. Stoudt. July 2018. "Sea Ice Outlook July Report." Published online at: https://www.arcus.org/sipn/sea-ice-outlook/2018/july.


